The Evolution of Electricity Costs in Johannesburg
The Evolution of Electricity Costs in Johannesburg. Following our analysis of Johannesburg's water tariffs, this study examines the trajectory of municipal electricity costs over the same 14-year period from 2012/2013 to 2025/2026. Using the exact same auditing methodology, we calculate the Annual Effective kWh Cost by dividing the total monthly municipal billing
 Ken Nunes 7 November 2026 3 min read
The Evolution of Electricity Costs in Johannesburg.
Following our analysis of Johannesburg's water tariffs, this study examines the trajectory of municipal electricity costs over the same 14-year period from 2012/2013 to 2025/2026. Using the exact same auditing methodology, we calculate the Annual Effective kWh Cost by dividing the total monthly municipal billing (including basic supply charges, maximum demand penalties, network capacity fees, and VAT) by the total energy consumed (kWh).
For School Governing Bodies (SGBs) and finance committees, this historical trend provides the data needed to establish clear operational targets, together with guidelines of a structured renewable energy strategy.
Analysing the 14-Year Trend (2012 to 2026)
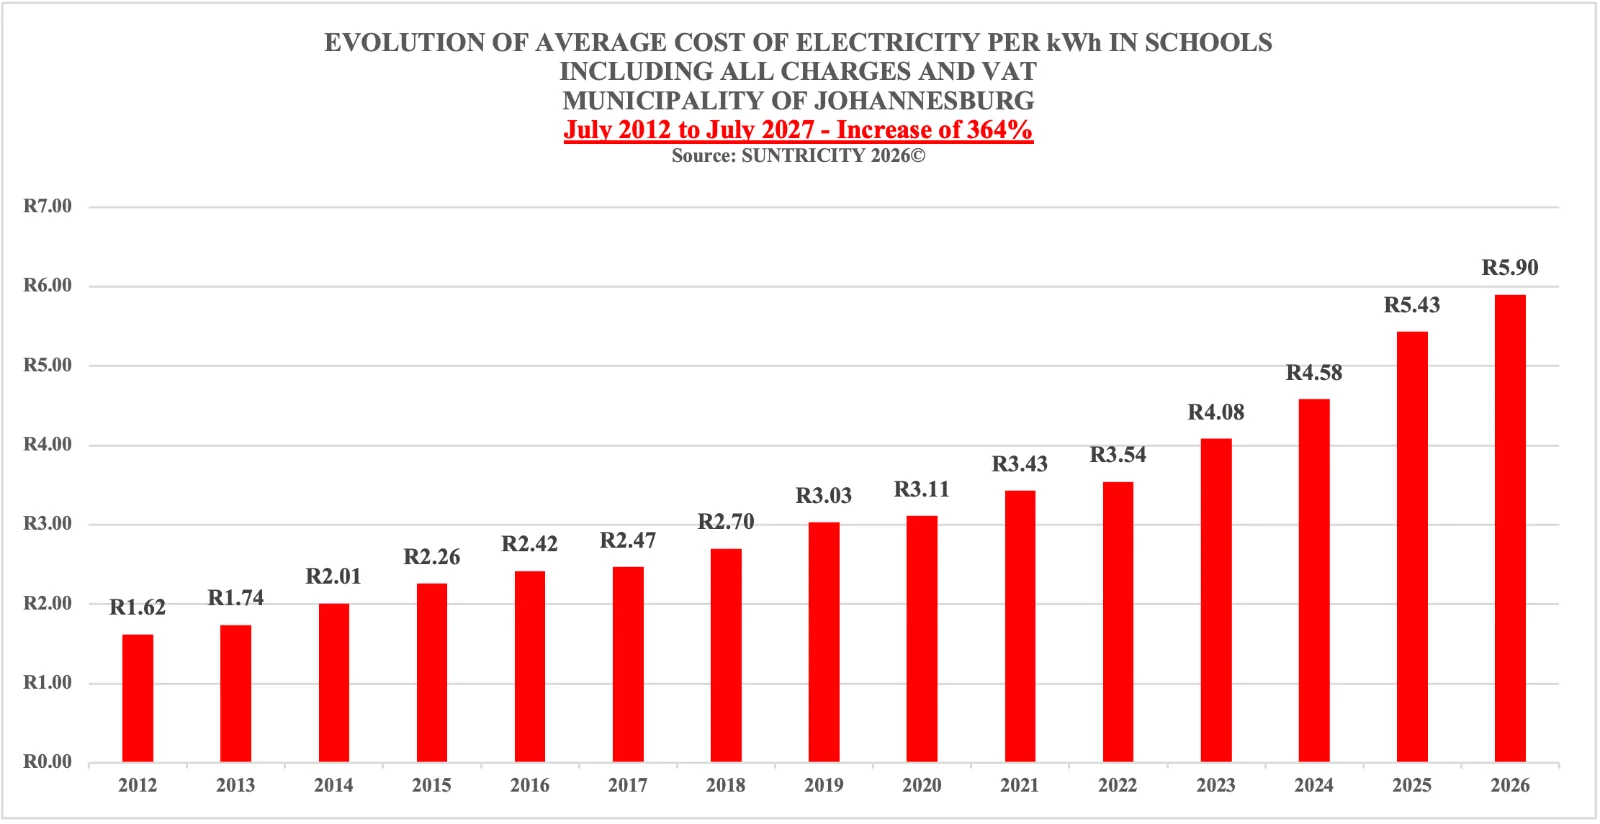
The chart above details the average cost per kWh based on the thousands of Johannesburg municipal invoices we have analysed over the past 14 years: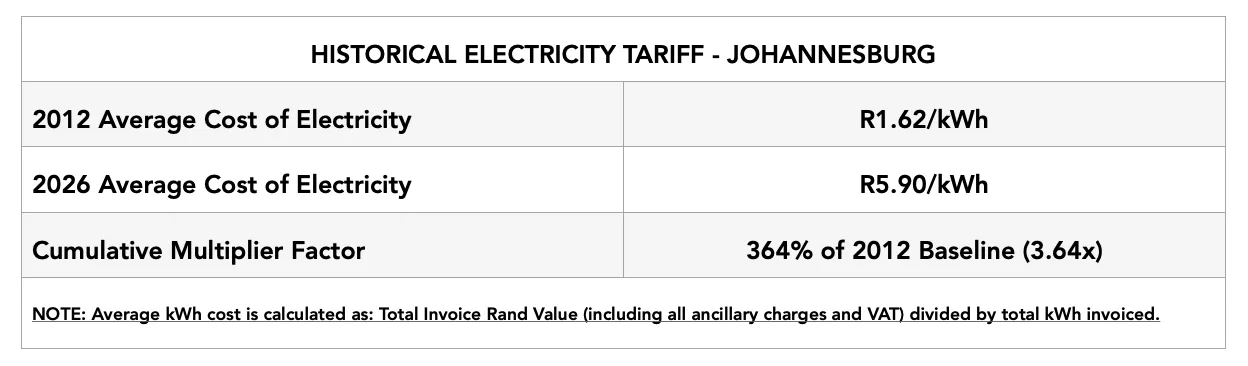
Between 2012 and 2026, the effective average cost of electricity in Johannesburg rose from R1.62 per kWh to R5.90 per kWh—reaching a staggering 364% of its original 2012 baseline.
For an average primary school consuming 70,000 kWh per year, the annual electricity bill has grown dramatically:
2012 Annual Spend: R113,400.00
2026 Annual Spend: R413,000.00
The 10-Year Outlook: Projecting Costs to 2036
With compounded municipal tariff adjustments averaging 9.7% annually over the past decade, schools face average electricity prices of between R13.30 and R14.85 per kWh by 2035/2036.
Assuming consumption remains unchanged, your average primary school's annual electricity expenditure will surge to R933,000 – R1,040,000 per annum by the end of 2036. Cumulatively, that single primary school will pay over R6.3 million to the municipality for electricity alone between the years 2026 and 2036.
Unlocking the Full Solar Potential: A Logical Roadmap for 2027
At R5.90 per kWh in 2026 (and climbing), municipal grid power is by far the most expensive energy your school will buy. Solar PV is a high-yield investment that typically achieves a full return on investment (ROI) within 3 to 5 years (depending on battery sizing), while delivering clean, reliable power for over 25 years.
Beyond solar generation, targeted low-cost low-hanging fruit efficiency measures are recommended where the ROI will be less than 12 months:
LED Lighting Upgrades: Transition all school lighting fixtures to high-efficiency LEDs, prioritising overnight security lighting that operates for 12 hours every night.
Smart Geyser Management: Fit digital timers to all hot water geysers, scheduling heating cycles strictly during daytime hours to maximise direct solar usage.
Building Financial Resilience for the Next 25 Years
Taking control of your school's energy future is one of the most impactful financial decisions a School Governing Body can make. Installations can even be implemented in two or three planned phases—ensuring school budgets are never overburdened.
By introducing zero-waste operational habits with scalable renewable power, your school effectively insulates electricity expenditure for the next 25 years.
Join the Suntricity Network today to establish your school’s baseline, right-size your solar roadmap, and claim your free 21-day trial.
Was this article helpful?